C# - Pie Chart
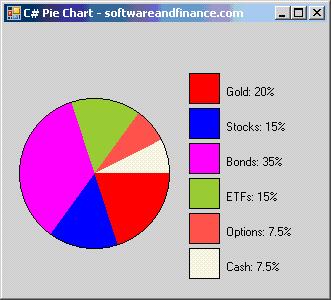
Pie Chart is something everyone would like to try with Graphics Programming. I have given here the complete source code and output and downloadable VS2005 project and executables.
Source Code
// PieChartForm.cs
using System;
using System.Collections.Generic;
using System.ComponentModel;
using System.Data;
using System.Drawing;
using System.Text;
using System.Windows.Forms;
namespace CSharpPieChart
{
public partial class PieChartForm : Form
{
public PieChartForm()
{
InitializeComponent();
}
struct PieInfo
{
public string desc;
public float percentage;
public Color color;
public PieInfo(string d, float p, Color c)
{
desc = d;
percentage = p;
color = c;
}
};
private Pen myPen = new Pen(Color.Red);
private PieInfo[] thePieInfo =
{
new PieInfo("Gold", 20, Color.Red),
new PieInfo("Stocks", 15, Color.Blue),
new PieInfo("Bonds", 35, Color.Magenta),
new PieInfo("ETFs", 15, Color.YellowGreen),
new PieInfo("Options", (float) 7.5, Color.Tomato),
new PieInfo("Cash", (float) 7.5, Color.Beige)
};
int theSliceCount = 6;
private void Form1_Paint(object sender, PaintEventArgs e)
{
float percent1 = 0;
float percent2 = 0;
float radius = 75;
int xCenter = 90, yCenter = 150;
Graphics myGraphics = e.Graphics;
float x = xCenter - radius;
float y = yCenter - radius;
float width = radius * 2;
float height = radius * 2;
for (int i = 0; i < theSliceCount; i++)
{
if (i >= 1)
percent1 += thePieInfo[i - 1].percentage;
percent2 += thePieInfo[i].percentage;
float angle1 = percent1 / 100 * 360;
float angle2 = percent2 / 100 * 360;
Brush b = new SolidBrush(thePieInfo[i].color);
myGraphics.FillPie(b, x, y, width, height, angle1, angle2 - angle1);
}
myPen.Color = Color.Black;
myGraphics.DrawEllipse(myPen, x, y, width, height);
float xpos = x + width + 20;
float ypos = y - 25;
for (int q = 0; q < theSliceCount; q++)
{
Brush b = new SolidBrush(thePieInfo[q].color);
myGraphics.FillRectangle(b, xpos, ypos, 30, 30);
myGraphics.DrawRectangle(myPen, xpos, ypos, 30, 30);
Brush b2 = new SolidBrush(Color.Black);
myGraphics.DrawString(thePieInfo[q].desc + ": " + thePieInfo[q].percentage.ToString() + "%", Font, b2, xpos + 35, ypos + 12);
ypos += 35;
}
myGraphics.Dispose();
}
}
}
// PieChartForm.Designer.cs
namespace CSharpPieChart
{
partial class PieChartForm
{
/// <summary>
/// Required designer variable.
/// </summary>
private System.ComponentModel.IContainer components = null;
/// <summary>
/// Clean up any resources being used.
/// </summary>
/// <param name="disposing">true if managed resources should be disposed; otherwise, false.</param>
protected override void Dispose(bool disposing)
{
if (disposing && (components != null))
{
components.Dispose();
}
base.Dispose(disposing);
}
#region Windows Form Designer generated code
/// <summary>
/// Required method for Designer support - do not modify
/// the contents of this method with the code editor.
/// </summary>
private void InitializeComponent()
{
this.SuspendLayout();
//
// PieChartForm
//
this.ClientSize = new System.Drawing.Size(323, 273);
this.Name = "PieChartForm";
this.Text = "C# Pie Chart - softwareandfinance.com";
this.Paint += new System.Windows.Forms.PaintEventHandler(this.Form1_Paint);
this.ResumeLayout(false);
}
#endregion
}
}
// MainProgram.cs
using System;
using System.Collections.Generic;
using System.Windows.Forms;
namespace CSharpPieChart
{
static class Program
{
/// <summary>
/// The main entry point for the application.
/// </summary>
[STAThread]
static void Main()
{
Application.EnableVisualStyles();
Application.SetCompatibleTextRenderingDefault(false);
Application.Run(new PieChartForm());
}
}
}
Click here to download the entire project and executable
Output

|
|