Jan 2012 - S&P 500 Yearly Forecast - Market would crash closer to Election
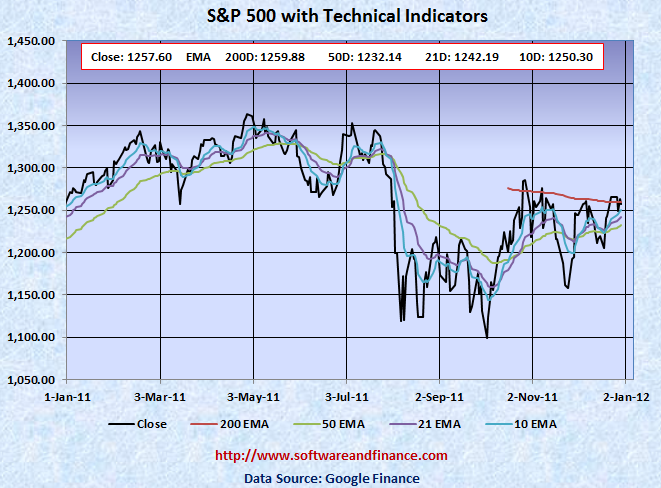
Dec 30, 2011 - S&P 500 closed today at 1257.60 which is exactly flat for this year. Last year Dec 31, 2010 close was 1257.64. S&P 500 was trading between 1074.77 and 1370.58.
To watch S&P 500 Index in google finance, visit the following link:
S&P 500 Index in Google Finance
To watch S&P 500 Index in yahoo finance, visit the following link:
S&P 500 Index in Yahoo Finance
Last Year Analysis
Here is S&P 500 Chart for one year with its tecchnical indicators. You can see it is exactly flat for this year. Even US treasuries yields are very low, market did not crash and stayed flat. It strong signals that the crash is most likely in 2012. Emerging markets like India and China has gone down for year 2011, but not US market. S&P did break its 200 days EMA couple of times this year, however it did not experience a deep plunge in year 2011.
S&P 500 might be waiting for the election to crash. US key interest rate has been set to near zero for the last years. It is unlikely they will increase the rate before the Nov 2012 US presidential election. That is another key factor S&P 500 did not crash during year 2011.

Year 2012 Forecast - Market would crash close to US presidential election
Long on US$ and that is going to be the safe heaven for the entire year 2012. Fed has to increase the interest rate shortly after the election which has be priced into stock market 6 months in advance. So the US long dated treasury prices would move down by increasing the yields. Usually increasing the yield is directly correaltes with stock market. We may see it is going to inversly related to stock market price movement this year 2012.
When we are getting closer to election, everything stocks, bonds, commodities would go down except US$.
It is a good idea to short on S&P 500 in the beginning of this year 2012, and cover it close to election. If you hesitate to short stocks directly, you can stay long on US bear ETFs like FAZ, TYP, etc. You can also consider investing in TMV. These ETFs - FAZ, TYP and TMV are currently trading at attractive levels. You may take long positions on these bear ETFs gradually and accumulate it whenever there is a good bargain in the market.
Technical Indicators
10 Days EMA: 1250.30
21 Days EMA: 1242.19
50 Days EMA: 1232.14
200 Days EMA: 1259.88
Next Resistance Levels:
strong resistance level at: 1259.88 set by 200 Days EMA.
strong resistance level at: 1386.95 set on Mar 16, 2007
strong resistance level at: 1433.06 set on Aug 03, 2007
strong resistance level at: 1440.70 set on Nov 23, 2007
strong resistance level at: 1453.55 set on Sep 07, 2007
strong resistance level at: 1,530.23 set on May 30, 2007 (first closing high after dot com bubble)
strong resistance level at: 1,552.87 set on Mar 24, 2000 (all time high during dot com bubble)
strong resistance level at: 1,565.15 set on Oct 09, 2007 (all time high during housing buble before sub prime crisis)
Next Support Levels:
minor support leval at: 1232.14 set by 50 days EMA
strong support level at 1189.40 set on Nov 26, 2010
strong support level at 1119.46 set on Aug 08, 2011
minor support level at 1064.59 set on Aug 27, 2010
strong support level at 1022.58 set on Jul 02, 2010
strong support level at 1036.18 set on Oct 30, 2009
strong support level at 946.21 set on Jun 12, 2009
strong support level at 827.37 set on Sep 27, 2002
strong support level at 683.38 set on Mar 06, 2009
strong support level at 638.73 set on Jul 19, 1996 - Might see this number again when completing double dip bottom
Posted on Dec 31, 2011