Turbo C++ Graphics - Plotting XY Scatter Graph
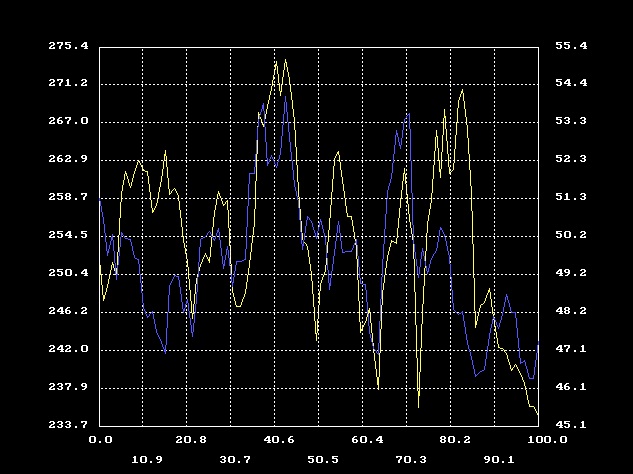
Here is the graphics program that can display graph by taking two sets of Y values and X values are common for the both.
Source Code
#include <stdio.h>
#include <string.h>
#include <graphics.h>
#include <stdlib.h>
#include <conio.h>
#include <bios.h>
#include <math.h>
#include <iostream.h>
double yarr1[] = {
251.97, 247.64, 249.10, 251.79, 250.19, 259.41, 261.75,
260.09, 261.70, 262.98, 261.93, 261.85, 257.25, 258.11,
260.96, 264.08, 259.28, 259.94, 259.02, 254.24, 251.89,
245.58, 249.90, 251.45, 252.73, 251.80, 257.28, 259.62,
258.09, 258.66, 248.63, 246.94, 246.94, 248.48, 251.53,
256.17, 268.30, 266.70, 269.00, 270.97, 273.85, 270.17,
274.07, 271.87, 267.25, 259.69, 254.28, 253.51, 250.51,
243.20, 249.33, 250.94, 255.96, 263.12, 263.95, 260.83,
256.88, 256.88, 253.35, 244.11, 245.22, 246.76, 242.32,
237.76, 248.34, 252.36, 254.22, 253.82, 258.36, 262.09,
256.52, 253.99, 235.86, 246.25, 255.98, 258.68, 266.35,
261.09, 268.64, 261.60, 262.04, 269.50, 270.83, 266.47,
259.22, 244.59, 247.07, 247.40, 248.92, 245.69, 242.43,
242.29, 241.79, 239.95, 240.60, 239.54, 238.49, 235.97,
235.97, 235.00
};
double yarr2[] = {
51.29, 50.71, 49.74, 50.31, 49.08, 50.37, 50.19, 50.17, 49.69, 49.62, 48.32, 48.05, 48.22, 47.68, 47.39, 47.09, 48.89, 49.21, 49.16, 48.18, 48.55, 47.53, 48.54, 50.17, 50.26, 50.39, 50.15, 50.48, 49.38, 49.99, 48.91, 49.58, 49.58, 49.62, 51.96, 51.98, 53.40, 53.88, 52.18, 52.45, 52.14, 52.52, 54.06, 52.96, 51.66, 51.17, 49.90, 50.79, 50.66, 50.20, 50.72, 50.19, 48.82, 49.83, 50.67, 49.81, 49.86, 49.86, 50.18, 48.99, 48.94, 47.64, 47.21, 47.05, 49.45, 51.49, 51.87, 53.15, 52.66, 53.43, 53.60, 50.14, 49.13, 49.94, 49.24, 49.66, 49.88, 50.51, 50.31, 49.70, 48.28, 48.13, 48.21, 47.36, 46.98, 46.46, 46.59, 46.65, 47.57, 48.09,
47.75, 48.14, 48.68, 48.19, 48.18, 46.81, 46.90, 46.40, 46.40, 47.41
};
static const int LTMARGIN = 100;
static const int TPMARGIN = 50;
struct XYScatterGraph
{
char yinfo[128];
int color;
int points;
double xpoints[1000];
double ypoints[1000];
double dataxmin;
double dataxmax;
double dataymin;
double dataymax;
double xlen;
double ylen;
XYScatterGraph() { }
XYScatterGraph(const char *yin, int c, int numpoints);
void FillPoints(double *yarr, int len);
void Draw();
void DrawGrid(int index = 1);
};
XYScatterGraph::XYScatterGraph(const char *yin, int c, int numpoints)
{
if(numpoints > 1000)
numpoints = 1000;
strcpy(yinfo, yin);
points = numpoints;
color = c;
for(int i = 0; i < 1000; i++)
{
xpoints[i] = 0.0;
ypoints[i] = 0.0;
}
dataxmin = 1000000;
dataxmax = -1000000;
dataymin = 1000000;
dataymax = -1000000;
xlen = 0;
ylen = 0;
}
void XYScatterGraph::FillPoints(double *yarr, int len)
{
for(int i = 0; i < len; i++)
{
if(i > points)
break;
xpoints[i] = i + 1;
ypoints[i] = yarr[i];
if(dataymin > ypoints[i])
dataymin = ypoints[i];
if(dataymax < ypoints[i])
dataymax = ypoints[i];
if(dataxmin > xpoints[i])
dataxmin = xpoints[i];
if(dataxmax < xpoints[i])
dataxmax = xpoints[i];
}
xlen = dataxmax - dataxmin;
ylen = dataymax - dataymin;
//dataxmax = dataxmax + xlen / 75.0;
//dataxmin = dataxmin - xlen / 75.0;
dataymax = dataymax + xlen / 75.0;
dataymin = dataymin - xlen / 75.0;
xlen = dataxmax - dataxmin;
ylen = dataymax - dataymin;
/*
cout << dataxmin << "\n";
cout << dataxmax << "\n";
cout << xlen << "\n";
cout << dataymin << "\n";
cout << dataymax << "\n";
cout << ylen << "\n\n";
*/
}
void XYScatterGraph::DrawGrid(int index)
{
int xmax = getmaxx() - LTMARGIN * 2;
int ymax = getmaxy() - TPMARGIN * 2;
setcolor(WHITE);
rectangle(LTMARGIN,TPMARGIN,LTMARGIN + xmax, TPMARGIN + ymax);
//setfillstyle(WIDE_DOT_FILL, WHITE);
setlinestyle(DOTTED_LINE, 1, 1);
double xstart = dataxmin;
double ystart = dataymax;
for(int i = 0; i <= 10; i++)
{
double ypos = TPMARGIN + (i / 10.0 * ymax);
double xpos = LTMARGIN + (i / 10.0 * xmax);
if( i != 10)
line(LTMARGIN, ypos, LTMARGIN + xmax, ypos);
line(xpos, TPMARGIN, xpos, TPMARGIN + ymax);
xstart = dataxmin + (i) * xlen / 10;
ystart = dataymax - (i) * ylen / 10;
char buf[128];
if(i == 0)
xstart = 0;
sprintf(buf, "%3.1lf", xstart);
if( (i % 2) == 0)
outtextxy(xpos - 10, TPMARGIN + ymax + 10, buf);
else
outtextxy(xpos - 10, TPMARGIN + ymax + 30, buf);
sprintf(buf, "%5.1lf", ystart);
if(index == 1)
outtextxy(LTMARGIN - 50, ypos - 5, buf);
else
outtextxy(LTMARGIN + xmax + 10 , ypos - 5, buf);
}
}
void XYScatterGraph::Draw()
{
int xmax = getmaxx() - LTMARGIN * 2;
int ymax = getmaxy() - TPMARGIN * 2;
int xold = 0;
int yold = 0;
setcolor(color);
setlinestyle(SOLID_LINE, 1, 1);
for(int j = 0; j < points; j++)
{
int xpos = LTMARGIN + (xpoints[j] - dataxmin) / xlen * xmax;
int bottom = 480;
int ypos = bottom - TPMARGIN - (ypoints[j] - dataymin) / ylen * ymax;
//cout << xpos << "\t" << ypos << "\n";
if(j > 0)
line(xold, yold, xpos, ypos);
xold = xpos;
yold = ypos;
}
}
void main()
{
int grd, grm;
detectgraph(&grd,&grm);
initgraph(&grd, &grm, "");
setbkcolor(BLACK);
int xmax = getmaxx() - LTMARGIN * 2;
int ymax = getmaxy() - TPMARGIN * 2;
XYScatterGraph myGraph1("Y", YELLOW, 100);
myGraph1.FillPoints(yarr1, 100);
myGraph1.DrawGrid(1);
myGraph1.Draw();
XYScatterGraph myGraph2("Y", LIGHTBLUE, 100);
myGraph2.FillPoints(yarr2, 100);
myGraph2.DrawGrid(2);
myGraph2.Draw();
getch();
closegraph();
}
Output

|
|