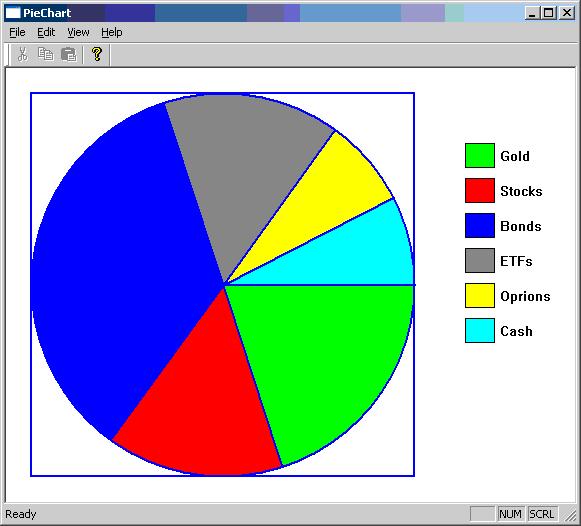
Visual C++ - Pie Chart Sample Application
Here is the code for drawing pie chart in Visual C++ using device context. I have given the source code for structure PieInfo and drawing code that uses rectangle, floodfill, lineto, moveto, etc.
You may see the application is not interactive. However it is easy to make it interactive. Just you have to refill the PieInfo thePieInfo[32] and int theSliceCount. The drawing would take place automatically. And also pie chart size will get adjusted, if you resize the application window.
Source Code
struct PieInfo
{
char desc[128];
double percentage;
COLORREF color;
PieInfo() { }
PieInfo(const char*d, double p, COLORREF c)
{
strcpy(desc, d);
percentage = p;
color = c;
}
};
extern PieInfo thePieInfo[32];
extern int theSliceCount;
PieInfo thePieInfo[32];
int theSliceCount = 0;
void CChildView::OnPaint()
{
CPaintDC dc(this); // device context for painting
CRect rect;
GetClientRect(rect);
int margin = 50;
int width = rect.Width() - margin;
int height = rect.Height() - margin;
if(height < width)
width = height;
else
height = width;
rect.left = margin / 2;
rect.top = margin / 2;
rect.right = width + margin / 2;
rect.bottom = height + margin / 2;
CPen pen(PS_SOLID, 2, RGB(0,0,255));
dc.SelectObject(&pen);
dc.Rectangle(rect);
dc.Ellipse(rect);
double xCenter = (rect.left + rect.right) / 2;
double yCenter = (rect.top + rect.bottom) / 2;
static const double PI = 3.1415926535;
double radius = rect.Height() / 2;
thePieInfo[0] = PieInfo("Gold", 20, RGB(0, 255, 0));
thePieInfo[1] = PieInfo("Stocks", 15, RGB(255, 0, 0));
thePieInfo[2] = PieInfo("Bonds", 35, RGB(0, 0, 255));
thePieInfo[3] = PieInfo("ETFs", 15, RGB(128, 128, 128));
thePieInfo[4] = PieInfo("Oprions", 7.5, RGB(255, 255, 0));
thePieInfo[5] = PieInfo("Cash", 7.5, RGB(0, 255, 255));
theSliceCount = 6;
double percent = 0;
for(int i = 0; i < theSliceCount; i++)
{
percent += thePieInfo[i].percentage;
if(percent > 100)
percent = 100;
double angle = percent / 100 * 360;
double x = radius * cos(angle * PI / 180);
double y = radius * sin(angle * PI / 180);
dc.MoveTo(xCenter, yCenter);
dc.LineTo(xCenter + x, yCenter + y);
}
radius = radius / 2;
percent = 0;
for(int i = 0; i < theSliceCount; i++)
{
percent += thePieInfo[i].percentage;
if(percent > 100)
percent = 100;
double angle = (percent - thePieInfo[i].percentage / 2) / 100 * 360;
double x = radius * cos(angle * PI / 180);
double y = radius * sin(angle * PI / 180);
CBrush br;
br.CreateSolidBrush(thePieInfo[i].color);
dc.SelectObject(&br);
dc.FloodFill(xCenter + x, yCenter + y, RGB(0,0,255));
}
double xpos = rect.right + margin;
double ypos = rect.top + margin;
for(int i = 0; i < theSliceCount; i++)
{
CPen p(PS_SOLID, 1, RGB(0,0,0));
dc.SelectObject(&p);
CBrush br;
br.CreateSolidBrush(thePieInfo[i].color);
CRect r(xpos, ypos, xpos + 30, ypos + 25);
dc.Rectangle(r);
r.DeflateRect(1, 1);
dc.FillRect(r, &br);
dc.TextOut(xpos + 35, ypos + 5, CString(thePieInfo[i].desc));
ypos += 35;
}
}
Click here to download the complete project and executable
Output

|
|